Total U.S. Soy Exports Add $39.8 Billion to U.S. Economy in Marketing Year 22/23
U.S. soybean meal exports break records for value and volume
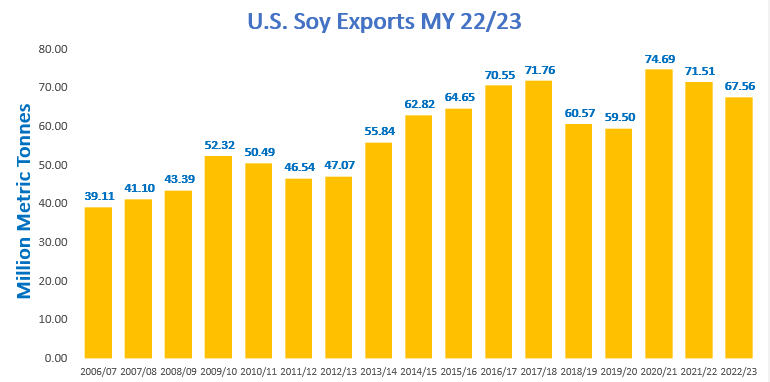
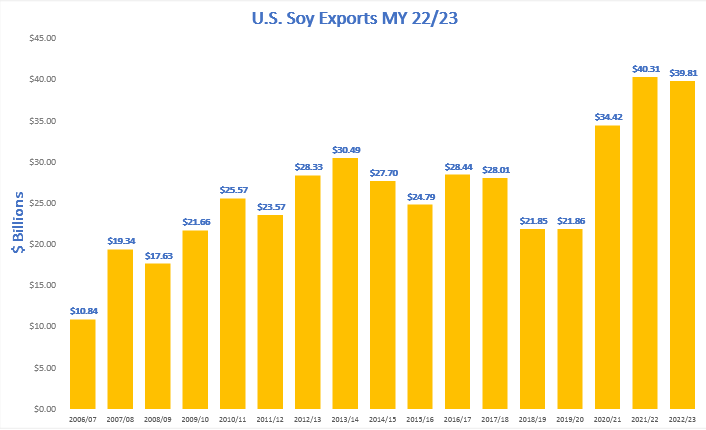
ST. LOUIS (Jan. 26, 2024) — U.S. Soy complex exports (whole soybean, soybean meal and soybean oil) added $39.8 billion[1] to the U.S. economy in marketing year (MY) 22/23 on a volume of 67.6 million metric tons (MMT).
The shining star: U.S. soybean meal exports broke records for both volume and value at 13.2 MMT and $6.91 billion, respectively.
U.S. soybean meal exports
While U.S. processors increased domestic soybean crush capacity, soybean meal has been at the forefront of many conversations. Increased demand in the last five years from both Colombia and Ecuador boosted U.S. soybean meal exports by 15% and 36% respectively above their five-year averages. Meanwhile, increased volume and higher prices saw U.S. soybean meal exports increase in value by 39% over the five-year average from MY 17/18 - MY 21/22.
“As we look out 10 years, soybean production is forecast to follow the rising productivity curve, continuing to increase on the same amount of land as new innovations, technologies and improved plant varieties become available to U.S. Soy farmers. This will allow the U.S. Soy industry to continue to meet the need of international (excluding-U.S.) whole soybean export demand, and U.S. domestic soybean crush demand[2],” says Jim Sutter, Chief Executive Officer of the U.S. Soybean Export Council (USSEC).
The top five markets by volume for U.S. soybean meal exports in MY22/23 were: Philippines (2.15 MMT), Mexico (1.66 MMT), Colombia (1.45 MMT), Canada (1.2 MMT) and European Union (EU) (0.816 MMT) with Ecuador, Venezuela and Guatemala following closely.
U.S. whole soybeans
Despite persistent global challenges to international business (COVID, climate, conflict, and currency), the volume of U.S. whole soybean exports at 54.2 MMT kept pace with the previous five-year average of 54.4 MMT.
“The consistency of whole soybean demand is impressive given the challenges our international food, feed and retail customers continue to face,” Sutter indicates. “I believe it is in recognition of the superior value of U.S. Soy, including its optimal nutritional bundle and refining value, lowest carbon footprint[3], low damage, and reliability — all of which help our customers deliver high quality food and feed products, while improving their bottom lines and advancing sustainability.”
U.S. soybean oil
Following U.S. investment and demand for sustainable aviation fuel and other renewable fuels, naturally U.S. soybean oil exports dipped 82% from the five-year average to 171,500 MT.
“This was not a surprise and reflects the investment in renewable fuels we see increasing in the United States,” says Sutter.
International market development strategy continues to drive customer satisfaction and growth
Looking at the total U.S. Soy complex, the top 5 markets during MY 22/23 were China (31 MMT), Mexico (6.6 MMT), EU (6.4 MMT), Japan (2.7 MMT) and the Philippines (2.3 MMT).
A market that saw significant growth from the previous MY was Vietnam with total U.S. Soy complex imports up 40% at 1 MMT. Markets demonstrating moderate growth year over year are EU (15%), Indonesia (9%), South Korea (7%), and China (5%). Morocco, Philippines, and Ecuador were also up slightly.
With export volumes keeping pace with the previous five-year average, higher prices drove an increase in value of the U.S. Soy complex exports which were 35.9% above the previous 5-year average (2018/19 to 2022/23).
“The U.S. Soy export value chain is the best in the world. Our ability to meet the needs of consumers, companies and countries around the world due to our expansive and robust infrastructure and logistics despite challenges, has been proven time and time again,” explains Sutter. “The U.S. export infrastructure has some valuable options which in times of challenge give us reliable flexibility. The U.S.’ ability to utilize a multi-modal approach allows for agility when necessary. U.S. Soy delivers whether it be by bulk vessel, rail, or container – U.S. East, West of Gulf Coasts, the Great Lakes, or the Pacific Northwest corridor so we can meet our customers’ needs.”
Every day around the world, USSEC has experts on the ground working to attain market access, differentiate and elevate a preference for U.S. Soy in the animal protein, aquaculture, soy foods and oil sectors. Recent initiatives include U.S. Soy marketing in 14 languages, investing in animal nutrition and aquaculture performance research, developing the Soybean Value Calculator, and collaborating with customers around the world to maximize the value from U.S. Soy products (beans, meal, oil) as well as advance sustainability leveraging our U.S. Soy Sustainability Assurance Protocol (SSAP) certificates or Sustainable U.S. Soy on-pack labels.
Due in part to these recent efforts, and those of the United Soybean Board, the American Soybean Association, State Soybean Boards and other USSEC members, U.S. Soy continues to be the United States’ No. 1 leading agricultural export both in value and volume.
###
About:
The U.S. Soybean Export Council (USSEC) focuses on differentiating, elevating preference, and attaining market access for the use of U.S. Soy for human consumption, aquaculture, and livestock feed in 80+ countries internationally. USSEC members represent the soy supply chain including U.S. Soy farmers, processors, commodity shippers, merchandisers, allied agribusinesses, and agricultural organizations. USSEC is funded by the U.S. soybean checkoff, USDA Foreign Agricultural Service matching funds, and industry. Visit ussec.org for the latest information on U.S. Soy solutions and news about USSEC and U.S. Soy internationally.
This press release is partially funded by U.S. Soy farmers, their checkoff and the soy value chain.
Media Contacts
Kerrey Kerr-Enskat
U.S. Soybean Export Council
+1.515.823.1848
kenskat@ussec.org
Erin Worrell
U.S. Soybean Export Council
+1.830.998.4624
eworrell@ussec.org

Data Source: USDA, Global Agricultural Trade System, Marketing Year 2022/2023.
U.S. Soy Complex = whole soybeans, soybean meal and soybean oil, combined. Whole soybeans MY: September to August, soybean meal and oil MY: October to September.

Data Source: USDA, Global Agricultural Trade System, Marketing Year 2022/2023.
U.S. Soy Complex = whole soybeans, soybean meal and soybean oil, combined. Whole soybeans MY: September to August, soybean meal and oil MY: October to September.
[1] Census Value of Exports, Marketing Year 2022/2023 Final Report
[2] ProExporter Blue Sky Model
[3] Blonk Consultants, Agri-footprint database 5.0 analysis, 2019
