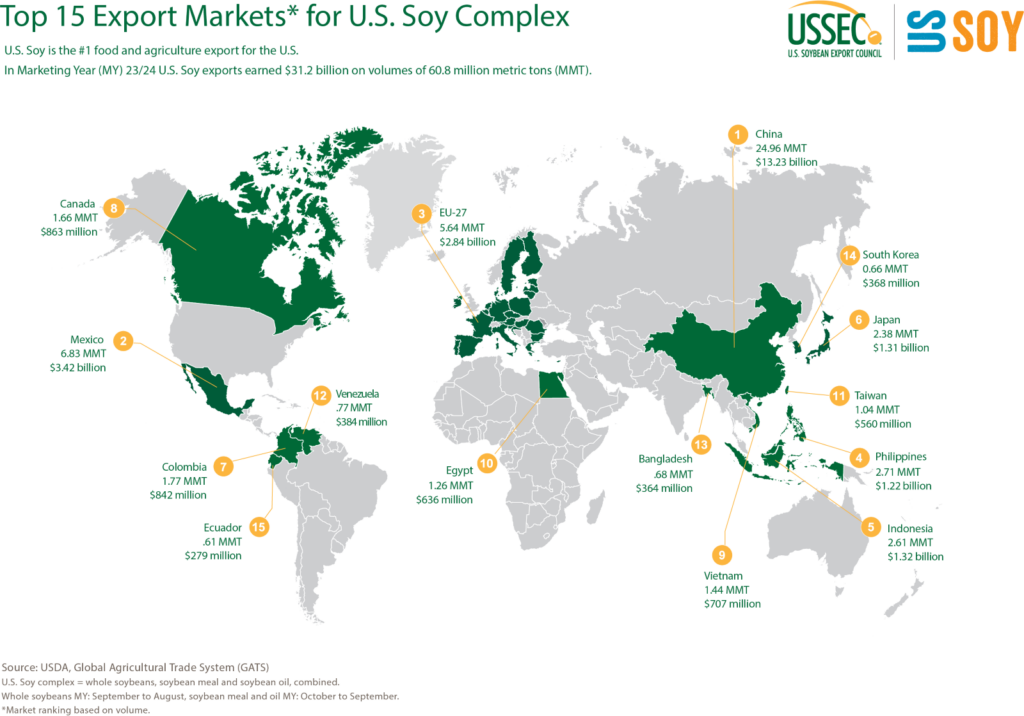
- Total U.S. Soy complex (whole bean, meal and oil), 60.8 million metric tons (MMT), valued at $31.2 billion.
- Whole soybeans, 46.1 MMT, valued at $24.2 billion
- Soybean meal, 14.4 MMT (up 10% from prior year), valued at $6.7 billion
- Soybean oil, 279,759 metric tons (MT), valued at $334 million
CHESTERFIELD, Mo., Dec. 5 — U.S. Soy remains America’s No. 1 agricultural export, adding $31.2 billion to the U.S. economy in marketing year (MY) 2023/24. While total soy export volumes were down from the year prior at 60.8 million metric tons (MMT), partly due to fewer carry-in stocks and expansion of domestic crush, U.S. soybean meal exports set a record based on increased supply, strong demand, competitive prices and its nutritional advantage.
“Last year at this time, the big question was ‘What are we going to do with all the soybean meal that stems from increased domestic crush as a result of the investments in sustainable fuels?’” recalled Jim Sutter, Chief Executive Officer for the U.S. Soybean Export Council (USSEC). “The answer: export it.”
“Our team of experts operating in 80-plus countries has been working to showcase the value of U.S. soybean meal through one-on-one meetings, technical seminars, education and advertising campaigns throughout the years.”
Buyers listened.
In MY 2023/24, exports of U.S. soybean meal reached a record 14.4 MMT, valued at $6.7 billion. This volume is up 10% from the year prior and 17% over the 5-year average.
The Philippines purchased the most U.S. soybean meal at 2.6 MMT in MY 2023/24; Mexico and Canada ranked second and third with 1.9 MMT and 1.4 MMT respectively.
While the Philippines has traditionally shown an affinity toward U.S. soybean meal and continues to grow, other countries with growing demand for U.S. Soy during the past five years are:
- Vietnam, up 110% at 743,942 metric tons (MT)
- Venezuela, up 94% at 653,217 MT
- Indonesia, up 49% at 192,922 MT
- Costa Rica, up 40% at 145,033 MT
- Sri Lanka, up 41% at 253,664 MT
- European Union - 27, up 37% at 721,473 MT
“USSEC continues to work with exporters and importers to diversify markets, expanding destinations while maintaining relations and sales with historic markets — not something that happens quickly. It takes years of work, relationship building and earning the trust of buyers,” Sutter added.
Great examples of market diversification are Egypt and Venezuela.
With a population of 104 million, Egypt is the third most populous country in Africa1. During the past 10 years and despite currency issues, imports of U.S. soybeans have grown 43% with an average annual value of $845.03 million2. This growth is due to Egypt’s booming poultry and aquaculture industries, which have led the way for increased soybean crush in the region The country’s poultry producers have achieved 100% self-sufficiency and are exporting to several countries.
While progress in Egypt has been years in the making, recent strides have also been made in Venezuela as a result of improved bilateral trade relations. It is among the Top 10 importing countries of U.S. soybean meal. Furthermore, U.S. Soy enjoys over 90% of the market share when looking at all soy imports to Venezuela, thanks to its geographic location, strategic partnerships and the intrinsic advantages of using U.S. Soy.
“This kind of progress is the culmination of year’s long efforts and relationship building by many of our partners in the U.S. and around the world that move the needle and build demand, benefitting all U.S. soybean farmers,” Sutter said.
According to the Agricultural Outlook 2024-2033, published by the Food and Agriculture Organization (FAO) of the United Nations, calorie intake is expected to increase by 7% in middle-income countries, largely due to greater consumption of staples, livestock products and fats3.
Looking at the year ahead (MY 2024/25) the U.S. Department of Agriculture (USDA) projects global soybean demand to increase 4.3% year-over-year to 346.2 MMT4.
The United States is the world’s second-largest producer of soybeans, and for every $1 invested in export market development, research shows a return of $14.26 in net revenue to soybean farmers5.
“Global demand for soy continues to rise,” Sutter said. “As a source of high-quality, sustainable nutrition, U.S. soybeans are an excellent solution to help meet the demand, enabling sustainable food and nutrition security around the world. USSEC’s job is to work in markets around the world to ensure customers understand the U.S. Soy advantage and how to purchase U.S. Soy.”

Source: https://www.usda.gov/sites/default/files/documents/USDA-Agricultural-Projections-to-2033.pdf, pg. 84

About the U.S. Soybean Export Council (USSEC):
The U.S. Soybean Export Council (USSEC) focuses on differentiating, elevating preference, and attaining market access for the use of U.S. Soy for human consumption, aquaculture, and livestock feed in 80+ countries internationally. USSEC members represent the soy supply chain including U.S. Soy farmers, processors, commodity shippers, merchandisers, allied agribusinesses, and agricultural organizations. USSEC is funded by the soy checkoff, USDA Foreign Agricultural Service matching funds, and industry. Visit ussec.org for the latest information and news about USSEC and U.S. Soy internationally.
###
This press release is funded in part by the soy checkoff.
MEDIA CONTACTS:
- Kerrey Kerr-Enskat, USSEC Director of Communications, +1 (515) 823-1848, kenskat@ussec.org
- Erin Worrell, USSEC Communications Manager, +1 (830) 998-4624, eworrell@ussec.org
- https://ussec.org/wp-content/uploads/2024/02/USSEC_Country_Market_Snapshot_2024_V2_Egypt.pdf ↩︎
- https://fas.usda.gov/regions/egypt ↩︎
- OECD-FAO: https://www.oecd-ilibrary.org/docserver/d87548df-en.pdf?expires=1731508344&id=id&accname=guest&checksum=A3AF19C6C51868147296CC827E3013D8 ↩︎
- “Oilseeds: World Markets and Trade,” published by USDA, November 2024, Pg. 17: https://apps.fas.usda.gov/psdonline/circulars/oilseeds.pdf
↩︎ - USB https://unitedsoybean.org/wp-content/uploads/2024/12/CA4344_20240830_Report_Return-on-Investment-002_USDAApproved_V2.pdf ↩︎
