Tighter Global Oilseed Supplies Calls for Greater Operational Efficiencies
- Category:
- Market Information
- Soybean OIl
In its September World Agricultural Supply & Demand Estimates report, the U.S. Department of Agriculture (USDA) lowered U.S. soybean production and ending stocks, as well as global oilseed production and global soybean ending stocks. Operating on tighter global supplies, businesses in the food and feed sectors are encouraged to consider how to do more with less.
Here are the key takeaways from the Sept. 12 report:
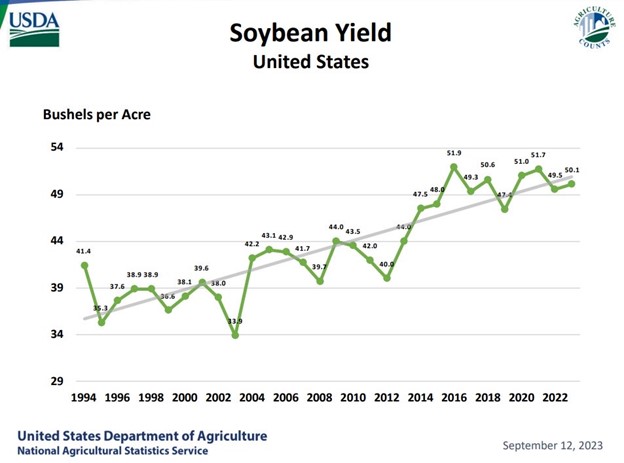
It’s important to note that despite weather concerns across much of the Corn Belt, U.S. Soy farmers have invested in conservation practices and innovative technologies, allowing for continued increased yields and production. See the chart below for a historical reference.
Outside of the global oilseed complex, one factor that might influence the broader food landscape is the wheat outlook. USDA lowered global wheat supplies, consumption, exports and ending stocks. Analysts reduced world ending stocks by 7 million tons to 258.6 million tons. If realized, this would be the lowest since 2015/16. This is primarily due to dry weather conditions across much of Australia and Canadian Prairies.
What might be surprising is that immediately after the report’s release November soybean futures fell by more than 1%, a sign the market had already accounted for a tightened supply.
Nonetheless, in the business world, tight supplies translate to higher costs, and depending on currency exchange rates, those price fluctuations impact some international buyers more than others.
“It’s always a good practice to look at your business with a critical eye and ask, ‘how can we be more efficient?’” says U.S. Soybean Export Council CEO Jim Sutter. “It’s even more important to do this when prices are high and global supplies are tight.”
However, Sutter cautions food and feed buyers who are looking for those efficiencies to look at the entire picture — not just the immediate savings.
“Cutting costs on soybean purchases from varying origins is not necessarily a savings,” he explains. “While you might be saving more up front, you’re spending more on the back end — it takes more to produce the same. It is important to understand the total value proposition which is something our USSEC team tries to help people around the world to do.”
As an example, research shows using soybean meal produced from U.S. Soy provides more energy from sucrose to the animal compared to meal produced from soy of other origins. You can learn more about that by checking out this factsheet. That means you can buy less and feed less while maintaining optimum animal performance.
Furthermore, the USSEC team has been hard at work showcasing how companies can use sustainability to improve profitability. U.S. Soy has the lowest carbon footprint compared to soy of other origins and other vegetable oils1. U.S. Soy farmers lead the way in addressing some of the world’s biggest challenges. They’re producing more while using fewer resources, implementing practices that reduce carbon footprint, and helping preserve forestland2.
At USSEC’s recent Soy Connext, Katie Gandy, Business Development Lead for S&P Global’s Sustainable1 business unit, reported about half of global food and beverage companies have made commitments to sustainable agriculture in their investor reporting with a focus on environmental practices.
And USSEC customers, such as Nuria Llanes, Purchase Manager for Cooperativa D’Ivars in Spain, echo that sentiment.
“One of our goals is to make it easy for buyers of U.S. Soy to demonstrate the sustainability of the product they are purchasing,” Sutter shares. “We have teams working in 82+ markets around the world, and I encourage anyone who is interested in learning more about how to increase efficiency in their operations — be it feed and animal nutrition, oil crush, or soy food — reach out to a USSEC team member. That’s why we are here.”
Learn more about USSEC and find a team member in your market at: ussec.org/directory.
This story was partially funded by U.S. Soy farmers, their checkoff and the soy value chain.
